I'm a former Amazon marketplace leader and current 8-figure seller. I write about advanced strategies and tactics for Amazon brands, that you won't read about anywhere else. Not for beginners.
◼️ 3 Metrics For Product Research That No One Talks About
This Issue's TLDR...
👉 Did someone forward you this newsletter? First of all, give them a crisp high five when you see them. Second, head over here to subscribe and read past issues. BEST from MeEvery seller has their own approach to product research. Some sellers keep things super...instinctual. They simply stick to products that they, as consumers, know well, and just make a better mousetrap. Some sellers look to ride trends. They monitor search trends through Amazon first-party data (e.g., Brand Analytics - Top Search Terms) or third-party resources like Exploding Topics. They keep open lines of communication with their supplier(s), and get cues on products that are getting increasing orders. And some sellers get really quantitative. They look for market opportunities though their own unique mix of "proprietary" predictive metrics. I've seen, and worked with, sellers that have had success with ALL of these methods, so, regardless of what "gurus" on social media tell you, there is no single product research method that universally and consistently outperforms all of the rest. That said, what worked for you last time won't necessarily work for you next time. The Amazon marketplace is too dynamic and, frankly, it's too hard to disentangle the role of luck and timing from past successful product launches. Future success requires adaptation, and new ways of thinking about product and market opportunities. But...Good news! That's exactly what this B@A issue is about. Let's dive in... 3 (Uncommon) Metrics That I Like to Look At1) Search-to-Purchase Ratio What It Is: Ultimately, this is a measure of customer intent. The ratio that Amazon provides in Category Insights defines this as the "number of times the ASINs were purchased as a ratio of total searches on these ASINs." Why I Like It: I don't try to create demand for my brands and products on Amazon. That's on my "too hard" pile. Instead, I look to harvest demand. That is, find products that customers are already looking for, and grab a share. Many sellers look at Search Volume for this. While I also look at Search Volume, I know that not all searches are created equal. If a product type is exploding in Search Volume, but there's low intent (as measured by Search-to-Purchase Ratio), then I pass. Where To Find It: In Seller Central, go to Growth > Marketplace Product Guidance > Category Insights. Search your category or sub-category, and then scroll down below the fold. 2) Ad Density What It Is: This is a proprietary metric created by my friends over at Momentum Commerce. They define it as "the percentage of search results that are sponsored in the the top 10 positions on a search results page for a basket of search terms." Why I Like It: I want to understand how much a particular category or sub-category is going to be "pay to play" for me. We all know that everything on Amazon is an ad these days, but the extent to which that is true does vary by category. With the Ad Density metric, and my expected unit economics, I can do some rough math on whether I can afford to advertise at the level required by the category. Where To Find It: It's one of the free tools offered by Momentum Commerce. Select your category, adjust the date period, and you'll see the Ad Density ratio on the right side. 3) Average Market Availability What It Is: This is a proprietary metric created by my friends over at Sellerise. They define it at the % of sales that come from outside of Positions 1-3 for a given niche. This video offers a brief explanation. Why I Like It: Similar to Ad Density, I'm trying to gauge the extent to which Where To Find It: You'll need a subscription to Sellerise for this. But, use my affiliate link and you'll get a break on price. Putting It All TogetherAs an illustrative example of how I use these three metrics, let's consider a hypothetical situation where I've identified two product/market opportunities: 1) Pickleball paddles and 2) CoQ-10 supplements. Let's further assume that all of the following are similar:
How do I break the "tie" here? This is where the three aforementioned metrics come into play. Starting with...STP Ratio. What I see immediately is that Pickleball shoppers have super low purchase intent (3.82%) relative to CoQ-10 shoppers (16.41%). This sort of makes sense. One product is more of a nice-to-have, the other product is more of a must-have. So, on the STP Ratio, the scale tips in favor of launching my CoQ-10 product. Let's look at Ad Density next... Basically a coin flip on Ad Density. Now, finally, let's look at Average Market Availability. On Average Market Availability, we see that 65.99% of Pickleball sales go to products outside of the Top 3, vs only 53.41% for the CoQ-10 niche. Taking these together, I'd probably choose in favor of Pickleball. While the greater customer purchase intent for CoQ-10 is compelling, I'm going to need to spend significantly to get to the Top 3, which is where all of the sales are. With Pickleball, I can invest moderately in paid traffic to get to the bottom of Page 1, and still capture a good amount of organic sales. Although my PPC spend might not convert at the rate that it would with CoQ-10, I can balance it out with a greater mix of organic sales. That's my thinking at least. I'd love to hear different points of view from my B@A readers. I'm right on the other side of this email... BEST from Everyone ElseBest from the B@A CommunityTwo weeks ago in this newsletter, I asked y'all if you could explain what was going on with the two different main image sizes in Andrei's tweet below. I had a lot of smart responses come back, but no one quite got it right. So, here's the answer... It's a WEBLAB. That is, the main images are rendering at different sizes because the PDP on the One Earth Health Beef Organs is a test treatment. The giveaway here are the virtual product bundles that appear directly below the Price field on the PDP for One Earth Health. (Amazon has been running this Weblab on and off for the past 2 months) PS: I'm never 100% sure of anything related to Amazon, but I'm 98% sure in this case. Especially because, if you look at these two products today, the main images render at the same size.
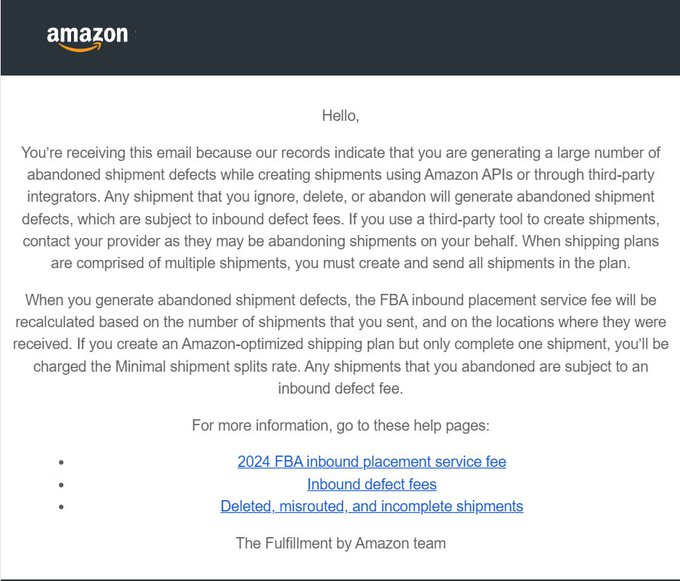
Best from my InboxDISCLAIMER: File this away under "Hmm, that's interesting" rather than a thoroughly-tested, proven strategy. This study result hasn't been replicated. OK, with that out of the way, I'll point you all to this study on The Impact of Roundedness of Price Numbers on Product Evaluations. Here's a bit from the study abstract: This research proposes that because rounded numbers are more fluently processed, rounded prices (e.g., $200.00) encourage reliance on feelings. In contrast, because non-rounded numbers are disfluently processed, non-rounded prices (e.g., $198.76) encourage reliance on cognition. Thus, rounded (non-rounded) prices lead to a subjective experience of "feeling right" when the purchase decision is driven by feelings (cognition). Basically, if the underlying purchase motivations of your customers are emotional, use round numbers in your prices. If the underlying purchase motivations are more functional or utilitarian, use non-rounded numbers. Best from XAmazon fired a warning shot last week at sellers that use software to (potentially) circumvent the new FBA Inbound Placement Fees.
Unless you like to live on the edge, this essentially reduces your option set to 1) suck it up and eat the fees, 2) adopt AWD, or 3) move your manufacturing to China, use AGL, and take advantage of AMPS. Everyone's fact pattern and priors are different but, all things considered, those options...kinda suck. That's why I was pumped to discover this 4th option/workaround to avoiding the FBA Inbound Placement Fees. As far as I know, no one is talking about this "hack" so let's keep it between us.
PS: I hope this tweet gave you a chuckle. I certainly had a laugh from it. Call it a belated April Fool's from B@A. Best from LinkedInMy LinkedIn friend, Andrew Bell, built an Amazon Optimization GPT and it's a nifty little free tool to add to your Amazon toolkit. I haven't done extensive testing (and, I recognize that it's only in beta), but I thought that the result below was...
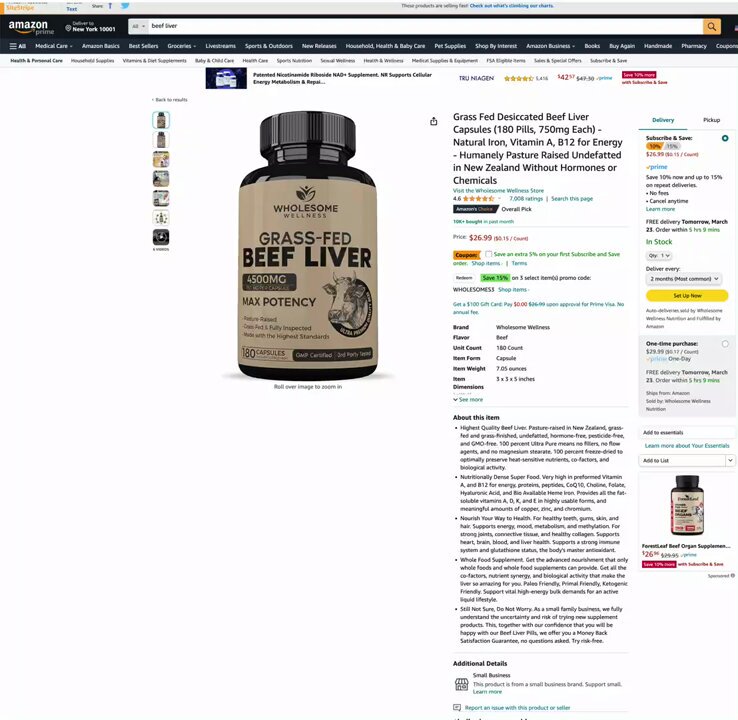
Here's what I did, and what the result looked like: Step 1: I copied the image of the best selling pickleball paddle on Amazon and uploaded to Krea.ai. Step 2: In Krea, I did some light photo editing and some Text-Image prompting, and got an image for my hypothetical product. Step 3: I uploaded this image to Amazon Optimization GPT, with one sentence about the brand (i.e., it should have a "vintage, athletic club" feel). And, here are the results: Updates to the Amazon Private Label PathwayNo updates this week. * Back Story on the Amazon Private Label Pathway, ICYMI... A few months back, I had a small group of coaching clients that were at the same point in their Amazon seller journeys. I found myself answering the same questions, and pointing them to the same resources, so, in true Amazon fashion, I asked myself "What's the 1-to-Many solution here?" and built a Notion page of helpful resources, which I've called "Amazon Private Label Pathway." You can get access to it here: https://auxo.gumroad.com/l/amazonpathway (it's free; but if you want to buy me a beer, I won't object) |


Best @ Amazon
The Newsletter for the Top 1% of Amazon Sellers
I'm a former Amazon marketplace leader and current 8-figure seller. I write about advanced strategies and tactics for Amazon brands, that you won't read about anywhere else. Not for beginners.
This Issue's TLDR... The one non-obvious thing that is hurting your sales. How well do you know your Amazon back-end attributes? An image hack that will immediately give you an advantage over 99.9% of other sellers. 👉 Did someone forward you this newsletter? First of all, give them a crisp high five when you see them. Second, head over here to subscribe and read past issues. SPONSOR Seller Sessions In case you didn't know...I'm going to be speaking at Seller Sessions in London in 9 days. And...
This Issue's TLDR... The Returns Processing Fee is coming. Are you ready? How to figure out if your Return Rate sucks. Does your Return Rate impact your product's ranking? 👉 Did someone forward you this newsletter? First of all, give them a crisp high five when you see them. Second, head over here to subscribe and read past issues. SPONSOR Seller Velocity Conference What are you doing on May 1-2? Me? I'll be in New York at Seller Velocity Conference. If you want to hang out with me there, or...
This Issue's TLDR... Are you paying for sales when you would otherwise earn those sales organically? I dive deep into the topic of PPC cannibalization. A big announcement from two members of the B@A community. How to figure out if your Click-Through Rate sucks. 👉 Did someone forward you this newsletter? First of all, give them a crisp high five when you see them. Second, head over here to subscribe and read past issues. SPONSOR Seller Velocity Conference What are you doing on May 1-2? Me?...